


Flowacts Logo
How it worksWhy FlowactsUse casesTemplatesPricingFAQ
Flowacts Logo
The workspace where you, your team, and AI build together.

Product

PricingContact Us

Resources

BlogHelp Center

Explore

TemplatesTools

All rights reserved. © 2026 Flowacts

Privacy PolicyTerms of Use
ToolsGantt Chart Maker

Gantt Chart Maker

Create a Gantt chart from a task list, project brief, launch plan, or schedule notes. Map start dates, end dates, durations, dependencies, task owners, progress, and milestones on a visual project timeline.

Once your project is created, you can use @ to mention pages or nodes and quickly link related context.

How to Make a Gantt Chart with Flowacts

A Gantt chart starts with the work that needs to happen, then places that work against time. Flowacts helps you turn tasks, dates, owners, and dependencies into a schedule view where each bar shows when a task starts, how long it lasts, and how it connects to the rest of the project.

01

Enter The Project Tasks

Start with a project name, task list, brief, or schedule notes. Add start dates, due dates, durations, owners, and known dependencies if you already have them. Rough timing is enough for the first version.

02

Build The Schedule View

Arrange tasks on a timeline and group related work into phases. Check task bars, overlapping work, milestones, blocked items, and dependencies so the schedule reflects how the project will actually move.

03

Refine Dates And Dependencies

Adjust labels, change durations, add owners, mark progress, and highlight key milestones. Use the finished Gantt chart for kickoff planning, weekly status reviews, stakeholder updates, or as the source for an Excel or Google Sheets schedule.

What Is a Gantt Chart?

A Gantt chart is a project schedule that shows tasks on one axis and time on the other. Each task is represented by a horizontal bar, with the bar length showing duration and the bar position showing start and end dates. Many Gantt charts also include owners, dependencies, milestones, progress, and status.

An online Gantt chart maker helps you create that schedule without manually drawing every bar in a spreadsheet or slide. With Flowacts, you can start from a task list, project plan, or rough brief, then shape the chart into a visual schedule for launches, software projects, construction plans, events, campaigns, operations, or client work.

Why Gantt Charts Work

Gantt charts make project timing visible. They help teams see what starts when, what can run in parallel, what depends on another task, and where the schedule may become overloaded.

See The Schedule In Context

A task list shows what needs to happen, but a Gantt chart shows when it happens. Start dates, end dates, durations, and milestones sit on the same timeline, making the project easier to scan.

Spot Dependencies Earlier

Some tasks cannot begin until another task is complete. A Gantt chart helps surface those relationships, so teams can see blocked work, handoffs, review windows, and deadline risks before they derail the schedule.

Keep Progress Visible

As work moves forward, progress bars, status labels, and milestone markers help stakeholders understand what is done, what is in motion, and what needs attention next in the project schedule.

Related tools & templates

Keep going with templates and tools for the same workflow.

Gantt Chart TemplateTemplates

Gantt Chart Template

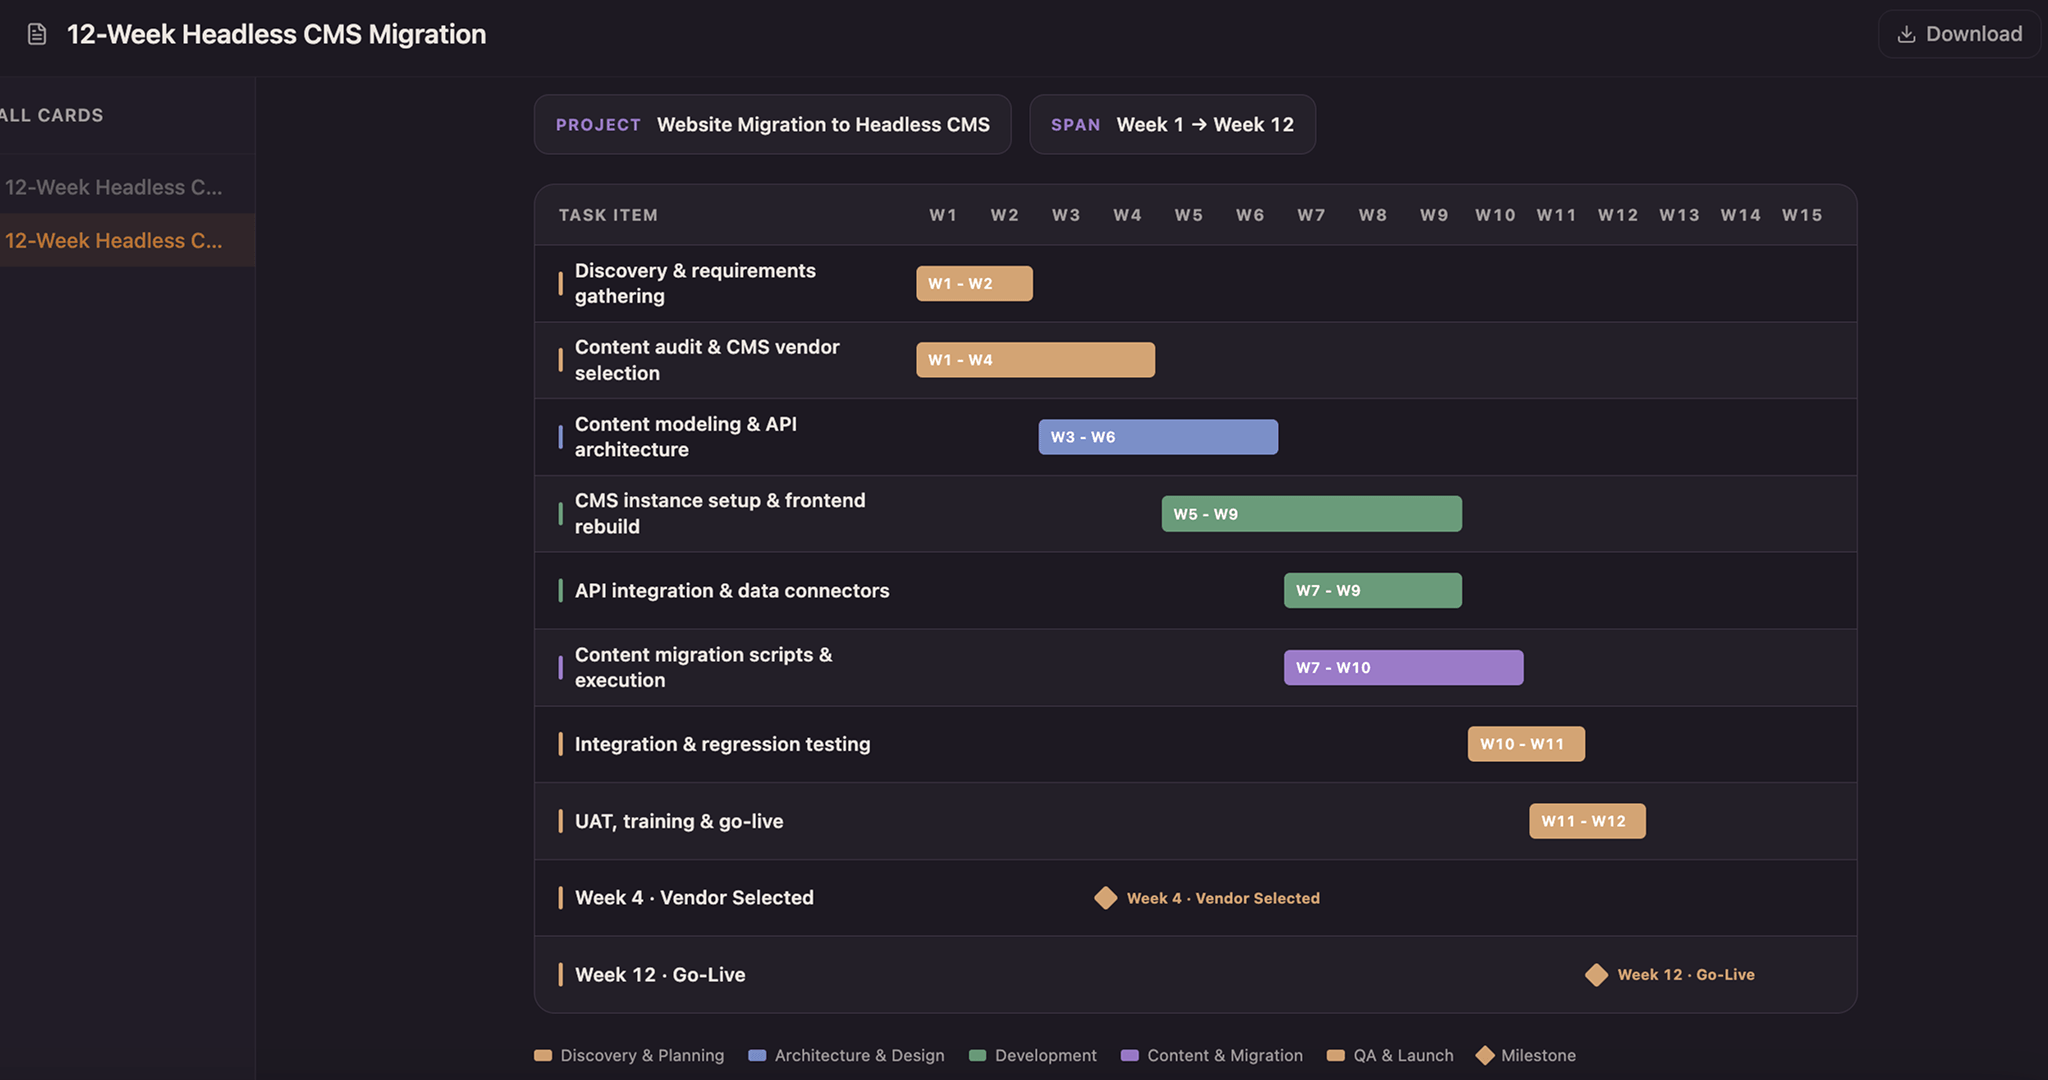
Lay every task as a solid bar across a twelve-week axis and color it by the team that owns it—copper for design, blue for build, green for test, purple for release—so a glance down any week shows who holds the schedule. Drag a bar to reschedule, snap it to whole weeks, and drop a milestone diamond on launch day.

Project PlannerTools

Project Planner

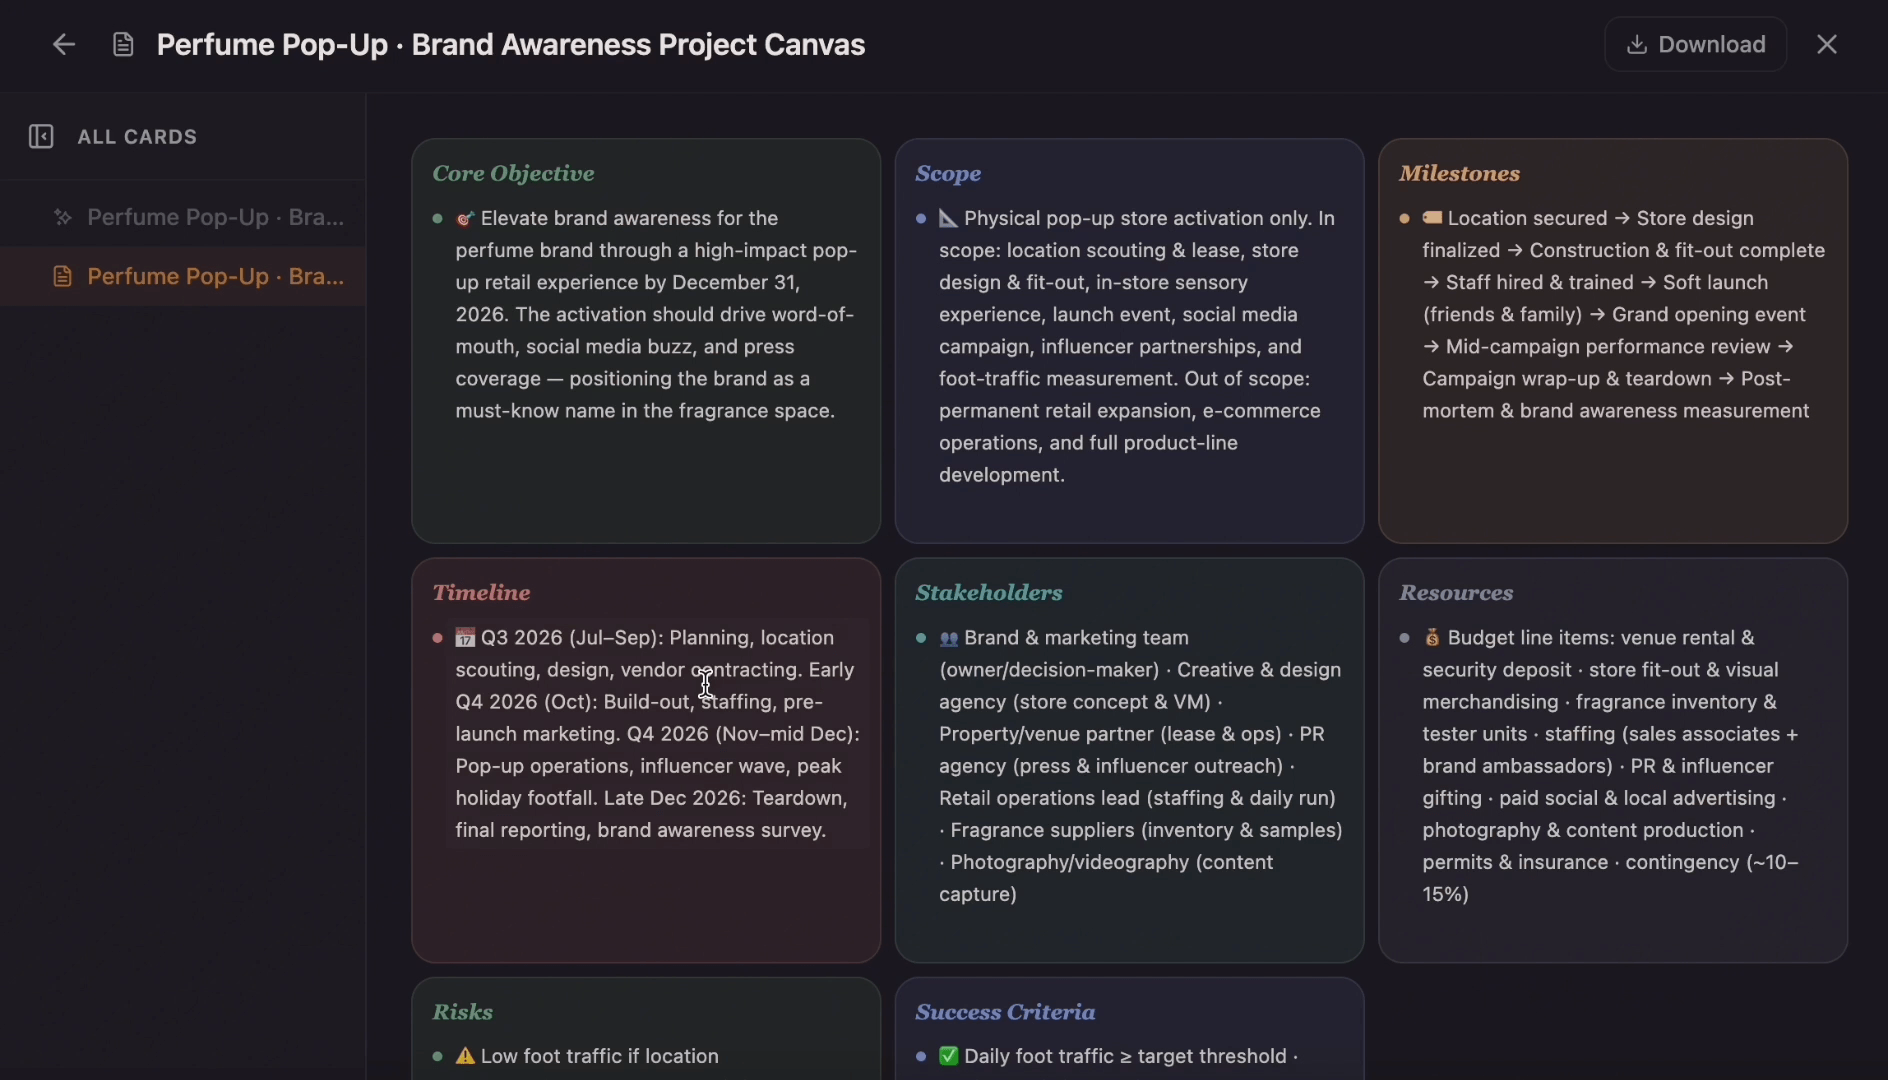
Create a project plan from a goal, brief, launch idea, client request, or team initiative. Map scope, tasks, owners, milestones, deadlines, risks, and resources into one editable planning canvas.

Timeline MakerTools

Timeline Maker

Create a timeline from project milestones, historical events, company moments, campaign dates, or lesson notes. Add the key dates, arrange the sequence, and shape the result into a visual timeline on canvas.

Project Planning TemplateTemplates

Project Planning Template

Ditch the flat spreadsheet and move from scattered task lists to a unified visual roadmap. Select this project management template to instantly generate a tailored workspace that maps out your exact project scope, timeline, deliverables, and blockers.

Frequently Asked Questions About Gantt Chart Maker

Quick answers for creating Gantt charts, planning schedules, and using Flowacts alongside spreadsheet tools.

A Gantt chart maker is a tool for creating a visual project schedule. It helps you organize tasks, start dates, end dates, durations, owners, milestones, progress, and dependencies in a chart where task bars are placed across a timeline.

Start by listing the project tasks, then add start dates, end dates, durations, owners, and dependencies. Place each task on the timeline as a horizontal bar, add milestones for important checkpoints, and review the schedule for overlaps or blocked work.

Yes. You can start with Flowacts as a free Gantt chart maker, enter a project brief, task list, or schedule notes, then refine tasks, dates, milestones, and dependencies on canvas.

Include task names, start dates, end dates, duration, task owners, dependencies, milestones, progress, and status. For larger projects, add phases, resource notes, deadline risks, and a current-date marker so the chart stays useful during status reviews.

Don't just chat it. Flowacts it.

Start with one idea. Leave with a canvas full of context, evidence, alignment, and next actions.